Anomaly
An Anomaly Detection Tool for Intellect
Anomaly is designed for detecting anomalies in your data. Anomalies are unusual events that may disrupt your production, indicate an impending failure, incorrect data and other bad situations. However, anomalies can be good things too and can lead to new discoveries about how things work. With Anomaly, you access and synchronize data, pre-process it as you desire to get the variables you want to monitor in the form you want, then apply any number of anomaly detectors. Validate your solution on historical data and then save your solutions to disk and put them on-line in the Intellect Server using Designer.
Create Data Handling Solutions

You can monitor raw data streams, but often you wish to create particular results to monitor. For example, in the data pre-processing of all the desktop tools there are functions that are particularly well suited for anomaly detection. One is "WinZ", the windowed Z-Score, the number of standard deviations a data point is from the mean. By windowing this function it becomes adaptive through time. Another is WinStdDev which is similar but is in the units of measure. You may also wish to monitor rates of change, moving averages, ratios and logs and other functions available to you. It depends on your application.
Build Detector Schemes
Anomaly comes with 5 different detectors. Some are univariate (watches one variable at a time) which can be applied to any variables you supply from the data pre-processing step. Others are multivariate which means they watch all variables as a system, together. More detectors can be added on request. All detectors have properties of the number of consecutive cases required so you don't get spurious alerts and latching so you get only one alert per occurrence, or for every occurrence while the condition exists.
- Anomaly Rule
Computes a result based on a data value compared to a threshold. This is useful when a data value is known to be abnormal when outside of limits, such as greater than, less than, equal to, between limits, outside of limits. - Anomaly Numeric Histogram
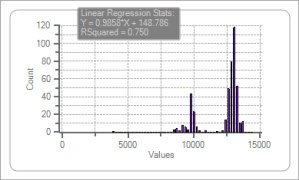
Identifies infrequent, therefore unusual values. Infrequency is defined by settable standard deviations when the data is "histogrammed". - Anomaly Stat High or Low
Identifies statistically high or low values compared to history when compared to a settable number of standard deviations. - Anomaly Systemic Range
Identifies when all values as a unit "orb" is excessively distorted as defined by a settable % distortion. - Anomaly Systemic Distance
Identifies if a multi-dimensional point is far from the historical cluster using a settable distance criterion and the number of nearest neighbors.
Any and all, and multiples can be applied in combination to create a solution. You can validate the behavior of your Anomaly solution on historical data.
When an alert fires you receive "facts", such as when it occurred, the name(s) of the variables, their values at the time, the reason for the alert and the degree the detector was violated. These facts are broadcast "downstream" to other tasks that can take some action automatically or issue email, text or other notifications.
"The Lego Blocks of Process Optimization"
~ M.T., Kuala Lumpur, Malaysia
"Very Clever"
~ R.H., Sunbury England
"This will be my legacy"
~ E.Z., Houston, TX
Send an email to tech@intellidynamics.net
Advantages and Benefits
- Detect abnormal behavior in your data, including process, materials and product characteristics
- Works with both text and numeric data through data pre-processing
- Access and syncronize your data into a unified data set
- Clean and filter your data so you are using valid, high quality data
- Pre-process your data into near infinite possiblities
- Detect process and product states
- Build flexible detection schemes
- Take action autonomously within Intellect or be alerted by email or text
Functionals
- Simultaneous data access to files, workbooks, relational databases, OSISoft PI and other historians
- Data synchronization into unified data sets regardless of where the data came from
- Data preprocessing using a wide array of functions with billions of permutations
- Numerous math functions: Change, SQRT, ln, LOG, ...
- Numerous smoothing functions: SMA, AMA, XMA, LWMA, ...
- Numerous trig functions: Sine, Cosine, Tangent, ArcSine, ArcCosine, ArcTangent, ...
- Walking windowed: Z score, Slope, Mean, Median, Min, Max, ...
- Binary 0-1 or -1 to +1 based on thresholds for probability estimation or conditional logic.
- Clipping filters (keep inside or outside of limits)
- Date-Time Regularizer (puts the data onto a consistent interval, usually by averaging in time “buckets”
- ADOExpressions (SQL calculation language)
- Totalizer to Rate
- Pull Forward to fill gaps
- Many, many more rare and useful, all with a click or two
- Apply numerous anomaly detectors, on one variable or all simultaneously as a system
- Anomaly Rules
- Anomaly Numeric Histograms
- Anomaly Stat High or Low
- Anomaly Systemic Range
- Anomaly Systemic Distance
- Data Visualization
- Trend plots, by row or time
- Histograms
- Scatter plots
- Validate your solution on historical data
Technicals
- Runs on Vista, Windows 7, Windows 8 and 8.1, Server and Desktop
- Operates with local or remote Intellect Servers on your network
- Memory depends on quantities of data. 4 GB minimum, 8 recommended, more is beneficial if using 64 bit version
- Multi-Core
- 32 or 64 bit available